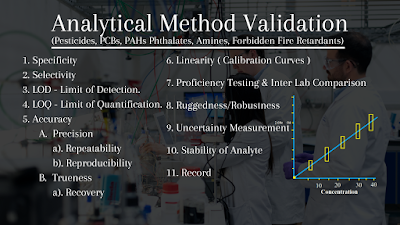
Analytical Method Validation
SCOPE AND APPLICATION
The protocol is based on ‘In house validation and instrument performance checking.
DEFINITIONS / ABBREVIATIONS
01. Specificity
02. Selectivity
03. LOD – Limit of Detection.
04. LOQ – Limit of Quantification.
05. Accuracy
a). Repeatability
b). Reproducibility
08. Ruggedness/Robustness
09. Uncertainty Measurement
REQUIREMENTS
I. Chemicals – Certified reference materials.
II. Glass wares – Calibrated glassware’s
III. Equipment’s – GC-MS, HPLC-UV & DAD Detector.
PRECAUTIONS
- Gloves and Nose masks
PROCEDURE
01. SPECIFICITY
I. For analytical methods, the power of discrimination between the analyte and closely related substances (Isomers, Metabolite, Degradation product, Matrix constituents etc.) is important.
III. Analyze appropriate number of respective blank samples preferably and check for any interference (signal, peak,) in the region of interest where the target analyte is expected to elute.
IV. Additionally, representative blank samples shall be fortified at a relevant concentration with substances that are likely to interfere with the identification/quantization of analyte
V. After analysis investigate
-
- The presence may lead to a false detection.
- Identification of the target analyte is hindered by the presence of one or more of the interferences.
VI. Quantification is influenced significally.
02. SELECTIVITY
I. Confirmation is the combination of two or more analyses that are in agreement with each other (ideally, using methods of orthogonal selectivity), at least one of which meets identification criteria). It is impossible to confirm the complete absence of residues.
03. LIMIT OF DETECTION (LOD)
The detection capability should be determined according to the requirements for identification + quantification.
- Representative blank material shall be used and spiked.
- The corresponding concentration at the detection limit as 3 times higher from the Signal Noise ratio of Blank Matrix.
- Analyzed minimum 6 blank materials shall be used.
- Analyze min 6 replicates for LOQ level.
- This Replicate analyze RSD Value shall be Maximum 20.
04. LIMIT OF QUANTIFICATION (LOQ)
The corresponding concentration at the Quantification limit as 3 times higher from the Detection limit.
- A blank matrix sample has to be spiked with the concentration considered as limit of quantification and analyzed at least 5 times under reproducibility conditions.
- This Replicate analyze RSD Value shall be minimum less than 20%.
05. ACCURACY
A. Precision
a). Repeatability
- Which means the closeness of agreement between mutually independent test results obtained under repeatability conditions
- Using the same method on identical test material in the same laboratory by the same Analyst using the same equipment within short intervals of time, often called for that short-term repeatability.
- At least 6 replicate analyses for each available concentration level have to be performed under the same conditions as for spiked samples.
- Repeat the above analysis at least 2 other Concentration.
- Find the mean, standard deviation, RSD (Using of Horwitz Equation) for the spiked samples
- The acceptable RSD Value is < 20%.
b). Reproducibility
- The Laboratory Reproducibility checks are conducted in the same laboratory on identical test samples on different days, by different analysts, with different instruments, using different calibration curves, and with different sources of reagents, solvents and columns.
- At the LOQ level perform the analysis with Minimum 6 replicates.
- Repeat the above analysis at least 2 other occasions, environmental condition, different batch of reagents, different instrument if possible.
- Find the mean, standard deviation, RSDR (Using of Horwitz Equation) for the spiked samples
- The acceptable RSD Value is <20%
B. Trueness
a). Recovery
- The percentage of the true concentration of a substance recovered during the analytical procedure.
- Take the matrix and spike LOD and LOQ Level.
- From the LOD Level 3 replicate should be analyze the sample matrix
- From the LOQ Level 10 replicate should be analyze the sample matrix
- % Recovery = 100 x Measured content/Spike level.
|
Concentration |
Range |
|
≤ 1 ppb |
50 – 120 |
|
> 1 ppb ≤ 0.01 |
60-120 |
|
> 0.01 ppm ≤ 0.1 |
70-120 |
|
> 0.1 ppm ≤ 1 |
70-110 |
|
> 1 ppm |
70 – 110 |
|
> 10 ppm |
80 – 115 |
|
> 0.01 % |
85 – 110 |
|
> 0.1 % |
90 – 108 |
|
> 1 % |
92 – 105 |
|
> 10 % |
95 -102 |
06. LINEARITY (CALIBRATION CURVES)
Where Calibration curves are used for quantification
- Minimum 5 level standards from LOQ should be used in the construction of the curve.
- The working range of the curve should be described.
- Goodness –of-fit of the data to the curve should be described
- Acceptability ranges for the parameters the curve should be described.
- When serial calibration based on standard solution is necessary acceptable range shall be indicated for the parameters which may vary from series to series.
Acceptance criteria for Linearity = Correlation coefficient 0.990(minimum)
07. PROFICIENCY TESTING & INTER LAB COMPARISON
By Publication in ILC/PT Whenever possible & to be qualified in IQC, Internal Quality Checks
08. RUGGEDNESS/ROBUSTNESS
These types of studies use the deliberate introduction of minor reasonable variations by the laboratory and the observation of their consequences.
- Identify possible factors that could influence the results.
- Vary each factor slightly Conduct a ruggedness
- Where a factor is found to in flounce the test results significantly conduct further Experiments to optimize this factor.
- Factors that significantly influence the results should be identified clearly in the method protocol.
09. UNCERTAINTY MEASUREMENT
The analytical result shall be reported as x ± u whereby x is the analytical result and u is the expanded measurement uncertainty.
using a coverage factor of 2 which gives a level of confidence of approximately 95 %
(U = 2u).
10. STABILITY OF ANALYTE
Wherever possible use positive sample
- The concentration of the analyte in the material should be determined when the material is fresh. Further aliquot of the material could be taken from the direct CRM-Every once in 6 Month, Primary standards every two months once, Secondary standards once in two weeks and the concentration should be determined. For the study to be conducted the tissues should be stored in -15°C.
- If no positive sample is available take some blank material and homogenize. Divide the material in 5 aliquots. Fortify each aliquot with the analyte which should be prepared in small quantify of aqueous solution. Analyze one aliquot immediately. Store the remaining aliquots at -20°C and analyze them after 1,2,4 and 20 weeks.
11. RECORDS
- Equipment logs notes
- Method validation file
- CRM Register
REFERENCES METHODS
- EU Directive 2002/657/EC,
- SANCO/10684/2009.
- AOAC Requirements for Single Laboratory Validation of Chemical Methods-2002-11-07
- EURACHEM/CITAC Guide CG4 Quantifying Uncertainty in Analytical Measurement

